Insurance Canopy logo
Search
888.600.0894
888.600.0894

Table of Contents

The State of Product Liability Insurance

Product Liability Facts & Statistics

For more than a decade Insurance Canopy has been an industry leader in providing businesses with top-rated product liability insurance. As we started to see trends in the industry, we started compiling data and pulling in outside research to gather a better understanding of product liability insurance and its role in businesses today.

The following information is a grouped study of information from Insurance Canopy and outside sources such as Lex Machina, Statista, and the Insurance Information Institute.

A woman smiles with a several bags of products.
The following information is a grouped study of information from Insurance Canopy and outside sources such as Lex Machina, Statista, and the Insurance Information Institute.

Product Liability Claims Statistics

Number of Claims

According to a product liability report by Lex Machina, in 2018 43,567 PL claims were filed, which rose in 2019 when 56,041 PL claims were filed (28.63% Rise YoY). In the last two years, this number has increased more so by at least 20%. On average, Insurance Canopy receives 9.6 claims per year—totaling an estimated $228,022 in damages.

Product Liability Case Filings
(Non Multidistrict Litigation)

Non Multidistrict Litigations are lawsuits that are not classified as a class action lawsuit. For example, a large pharmacy company or multi-billion dollar manufacturer. These types of larger, class action lawsuits award hundreds of millions of dollars at a time to thousands of recipients living in different districts.

For the purpose of this study, we wanted to exclude this type of information and focus on data that more accurately reflects the types of businesses we serve at Insurance Canopy.

The following are the number of non multidistrict product liability lawsuits filed per year

2017:
3227 Lawsuits
2018:
4943 Lawsuits
2019:
4943 Lawsuits
*For defect cases (the most common basis for a product liability lawsuit) negligence was the most common claimant win, while no breach of warranty was the most common defendant win.

Resolutions for Case Terminations

According to Lex Machina’s findings, 66% of liability cases will conclude in a settlement between the claimant and defendant. An additional 28% are met through procedural resolution, while the remaining 6% are either a defendant or claimant win.

*For defect cases (the most common basis for a product liability lawsuit) negligence was the most common claimant win, while no breach of warranty was the most common defendant win.

Product Risks

In insurance, a risk means there is a level of uncertainty that can arise from your products or business operations. Some products carry higher risks than others, such as power tools or ingestibles. At Insurance Canopy, we work hard to offer policies for products that many insurance companies refuse coverage for due to their risks.
21.18% of the products we cover are nutraceuticals or cannabis products, which are classified as high-risk products. Other high-risk products we may cover include:
Power Tools Icon

Powered hand tools

Appliances Icon

Electrical appliances

Sports Equipment Icons

Sporting good products

Medical Equipment Icons

Medical and dental products

Cost of Insurance

Because every product is not the same, neither is every product liability insurance policy. On average, our customers pay between $800-$2200 for their annual premiums. Factors that could affect the cost of a product liability insurance quote include:
industry cost icon card
business size cost icon card
revenue cost icon card
limits cost icon card
claims history cost icon card

Total Product Liability Damages Awarded

Per a 2020 Report done by Lex Machina, the following product liability statistics were gathered. They focus on the total amount businesses paid out to claimants in product liability lawsuits from 2017–2019.

From 31 Cases
In 2017
$ 0

From 33 Cases
In 2018
$ 0

From 23 Cases
In 2019
$ 0

Average Cost of a Product Liability Claim with Insurance Canopy

From 2015–2020, 48 claims were filed for a total estimated cost of $669,233—and an average of $25,336 in just 2020 alone. Even if you have strict product testing and carefully monitor product safety, accidents can still occur. A single claim could lead to a halt in production, damaged business relationships, and loss of customer trust.

Insurance Canopy has seen an increase in
product liability claims since 2016.

Product Liability Claims Made

Product Liability chart shows claims made on a graph since 2016. Insurance canopy has seen an increase in product liability claims since 2016.

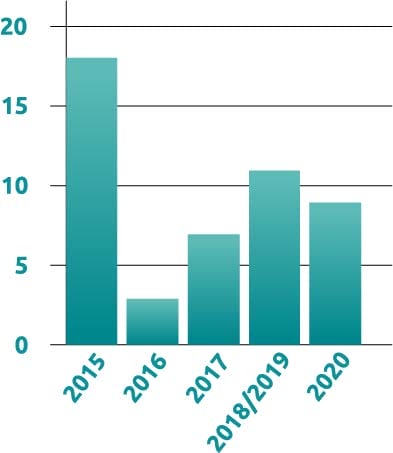
*2018/2019 policies were written for 18 month periods.

Per the Information Insurance Institution, product liability has the highest average amount of payouts awarded. This was measured by type of liability per personal injury jury awarded in 2020.


Product Liability
$ 0

Business Negligence
$ 0

Vehicular Liability
$ 0

Most Common Claims

Amongst Insurance Canopy customers, most product liability claims come from manufacturers’ defects. This means there was a flaw in the design of the product, impairing functionality and increasing the risk of injuries or damages.

Because 31.6% of customers are manufacturers, and manufacturers defects are the leading liability claim, having product liability insurance can be key in keeping claim costs low.

Median Timelines of Product Liability Case Resolutions

Product liability lawsuits can be drawn out over years and remain very costly at length for business owners. According to a report done by Lex Machina, you can expect to spend anywhere from one to years handling a product liability lawsuit. The median timeline for these lawsuits are as follows:
To Reach Case Termination
0 Days
To Reach Trial
0 Days
To Reach Summary Judgement
0 Days

Who Uses Product Liability Insurance?

Location

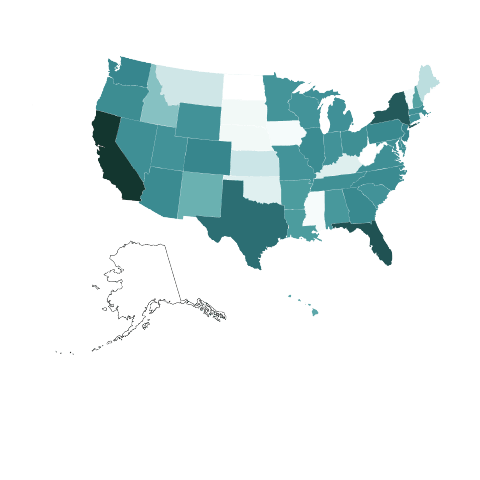
In the United States, California has the largest number of businesses that opt into product liability insurance at a rate of 18.11%.* Additionally, almost a third of businesses using product liability insurance are based throughout Florida (11.24%), New York (9.93%), and Texas (7.37%).

In terms of direct premiums, California has the highest on average ($612.45), followed by Texas ($356.87), and then New York ($348.56).

Looking at states by growth of product liability direct premiums year over year, South Dakota had the largest percentage rise at 22%, followed by Virginia (22%), and then Illinois (16.52%).

A heatmap of the United States by Product Liability policy owners.

Insurance Canopy
Product Liability Heatmap

*It is important to note California is a ‘strict liability’ state. Strict liability means the court makes no judgment based on good-faith intentions or no-fault responsibility; it pertains only to the fact that an injury or damage occurred. Where a negligence claim must prove the injuries or damages were caused by negligent or careless acts, strict liability only needs to show injuries or damages were sustained. This law has pushed more California-based business owners to invest in product liability insurance to help cover their costs in the instance of a liability claim.

Gender

When looking at gender as a variable, we found that 47% of business owners with product liability insurance are female, while 53% are male.

Business model

When looking at the supply chain, manufacturers and distributors make up 58.1% of businesses who have product liability insurance.

Product Category

A visual representation of the previously listed product categories.
Most of the products we cover use beauty product insurance. This can be used for products such as make-up, skincare products, candles, perfume, and personal care products. Because the number of beauty insurance policies increases each year, our data shows the beauty and cosmetic industry is growing at a steady rate.

Marketplaces

60.46% of people applying for product liability insurance sell in online marketplaces, while 39.54% sell in stores, at events, and in other physical locations.

Online 60.46%

39.54% Physical

Amazon Sellers and Product Liability Insurance

Global ecommerce sales are projected to reach up to $5 Trillion in 2022—an estimated 20.4% of global retail sales—and $6 trillion by 2024. 

In addition, 51.2% of all U.S. retail sales in 2020 went through Amazon. This equates to $386.1 billion of gross merchandising value. For comparison, Amazon had $280.5 billion of products sold in 2019, and $469.8 billion in 2021.

Amazon Seller Requirements

If you make $10,000 in sales in 30 days, Amazon now requires you to have product liability insurance. This helps protect you as a seller and Amazon as a marketplace in the case of a product liability claim. According to the Amazon Pro Merchant Insurance Requirements, you must:
  1. Show proof of insurance
  2. Provide an original Certificate of Insurance document completed in its entirety and signed
  3. Have a policy with a general liability limit of at least $1 million dollars, is written on an occurrence basis, cover all sales from products you have listed on the Amazon website, and includes product liability insurance (bodily injury and property damage), personal injury insurance, and any other requirements outlined in the Participation Agreement
  4. Name “Amazon.com Services LLC., and its affiliates and assignees” as additional insureds
  5. Have a valid policy for at least 60 days from the date of submission, and your provider must give Amazon a minimum of 30 days’ notice of cancellation, modification, or nonrenewal
  6. Verify your insured name matches the “legal entity” name you provide to Amazon
  7. Be sure your insurance provider has global claim handling capability and a financial rating of S&P A- and/or AM Best A- or better
  8. Ensure the deductible for any policy must not be greater than $10,000 and any deductible amount is listed on the Certificate Of Insurance
300 million active customers | 195 million monthly unique visitors (in the U.S. alone) | $1.5 billion reported sales by third-party business during Prime Day 2018 according to information provided in Amazon's Beginners Guide to Selling on Amazon.

Insurance for Other Online Sellers

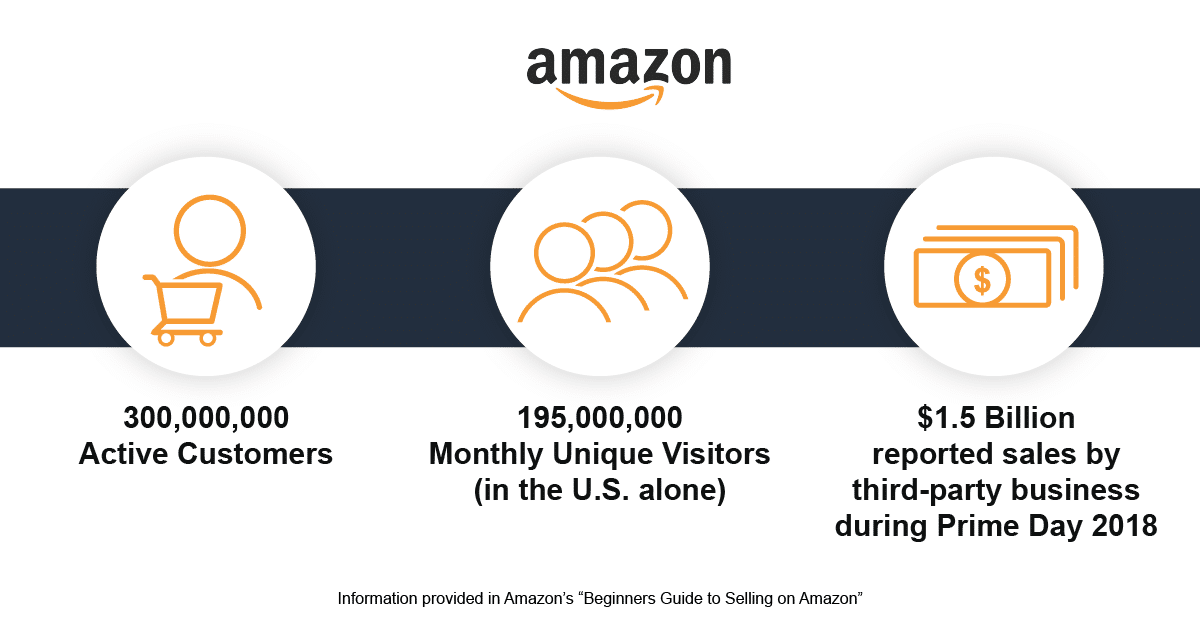
Other online sellers such as Etsy totaled ~$10.28 billion in sales in 2020, while eBay’s gross merchandising value (GMV) grew to $100 billion in 2020, along with drawing in over 160 million users.

Product liability claims & risks are on the rise, as is the amount of money being made through ecommerce sales. As online marketplaces continue to grow, you can expect the number of lawsuits to grow with it.

Here are some insights we think you can expect to see over the next few years:

Product Liability Forecasts

Product liability claims & risks are on the rise, as is the amount of money being made through ecommerce sales. As online marketplaces continue to grow, you can expect the number of lawsuits to grow with it.

Here are some insights we think you can expect to see over the next few years:

Product liability lawsuits, net premiums, and average claim payouts have all steadily increased over the last decade. This trend is expected to continue over the next decade, with claims expected to continue to rise ~20% over the next 2 years.
Direct premiums have risen over the past few years, and will continue to rise as the market becomes more risky with increased claims. States that are growing the most currently in terms of business growth are seeing the highest increase in average premiums year over year. For example, South Dakota saw a 22% increase.

Product liability claims on average leave businesses paying over double the amount of the next highest personal injury award.

The median product liability case can last at least two years. With more cases being filed and and increased legislation protecting consumers, expect these timelines to become more drawn out over the next decade.
An estimated 60% of product liability insurance applicants sell in online marketplaces, while the 2024 global ecommerce sales amount is projected to reach $6 trillion. More businesses are adapting to the online consumer, and this market is expected to continue to grow at a fast rate.
In 2020, Amazon accounted for 51.2% of U.S. retail sales, which equates to $386.1 billion. With increased competition, this percentage of share is expected to drop a small amount over the next few years. But with the increase of online sales, Amazon gross merchandising value should still continue to grow at a similar rate as it has the past few years.
Etsy, eBay, and other ecommerce sites maintain a large amount of sales and users, and they should continue to grow in revenue as well with the ecommerce market. This means we will see a higher number of ecommerce-related product liability lawsuits in the future.
Product liability claims have been rising each year (non multidistrict litigations), as well as their average payout per personal injury awarded, and the net premiums for product liability insurance.
Manufacturing defects are the #1 cause of a product liability claim, and this isn’t going anywhere just because the market is shifting more toward ecommerce than traditional brick and mortar sales.

To summarize, ecommerce sales have been and are projected to continue growing at a fast rate through 2026. The increase in global ecommerce sales opens opportunities for more businesses to enter the market, though barriers to entry may be higher.

Taking everything into account, having a product liability insurance policy in place with your business can help you save tens of thousands if not hundreds of thousands of dollars in terms of raw payout value, as well as avoiding the years of litigation that will take place if liability has been determined.

Regardless of businesses being strictly ecommerce, brick and mortar, or both, stricter legislation to further protect the consumer is being introduced—and product liability lawsuits will continue to rise for all businesses over the next couple of years.

Methodology

Data Collection

All data collected is from active insurance policies with Insurance Canopy from 2015–2021. A sample size of 2,739 active policyholders was studied with individuals representing all 50 U.S. states, a variety of marketplaces and products, and a range of differing policy types

Additional Sources

Any information outside of our initial research pool was used in conjunction with our own findings. A list of these sources can be found below: